
Today we're announcing two new features that will help you better manage and run apps on Heroku: Threshold Alerting and Hobby dyno metrics. Threshold Alerting provides the ability to set notification thresholds for key performance and health indicators of your app. We’ve also extended basic Application Metrics to Hobby dynos to provide basic health monitoring and application guidance. Together these features allow you to stay focused on building functionality by letting the platform handle your app monitoring.
Threshold Alerting
There are many ways to measure the health of an application. The new alerting feature focuses on what is most important to the end users of your app: responsiveness and request failures.
Responsiveness is measured by tracking the maximum response time for 95% of the requests, known as the 95th percentile (or p95) response time. When measuring response time to gauge how users are experiencing your app, it is important to focus on the overall distribution of responses and not just the average response time of requests. The 95th percentile measure has become a best practice in the industry and Heroku has always tracked this measure for your apps and displayed it on the Metrics view. Now you can define alerts that are triggered if the p95 response time exceeds the threshold you specified.
In addition to response time, the request error rate is an important indicator of application health. If the percentage of failed requests suddenly spikes, you can now be alerted that something might be wrong with your app.
Alerting is available on apps running on Professional dynos (Standard-1X and up).
Alert Configuration
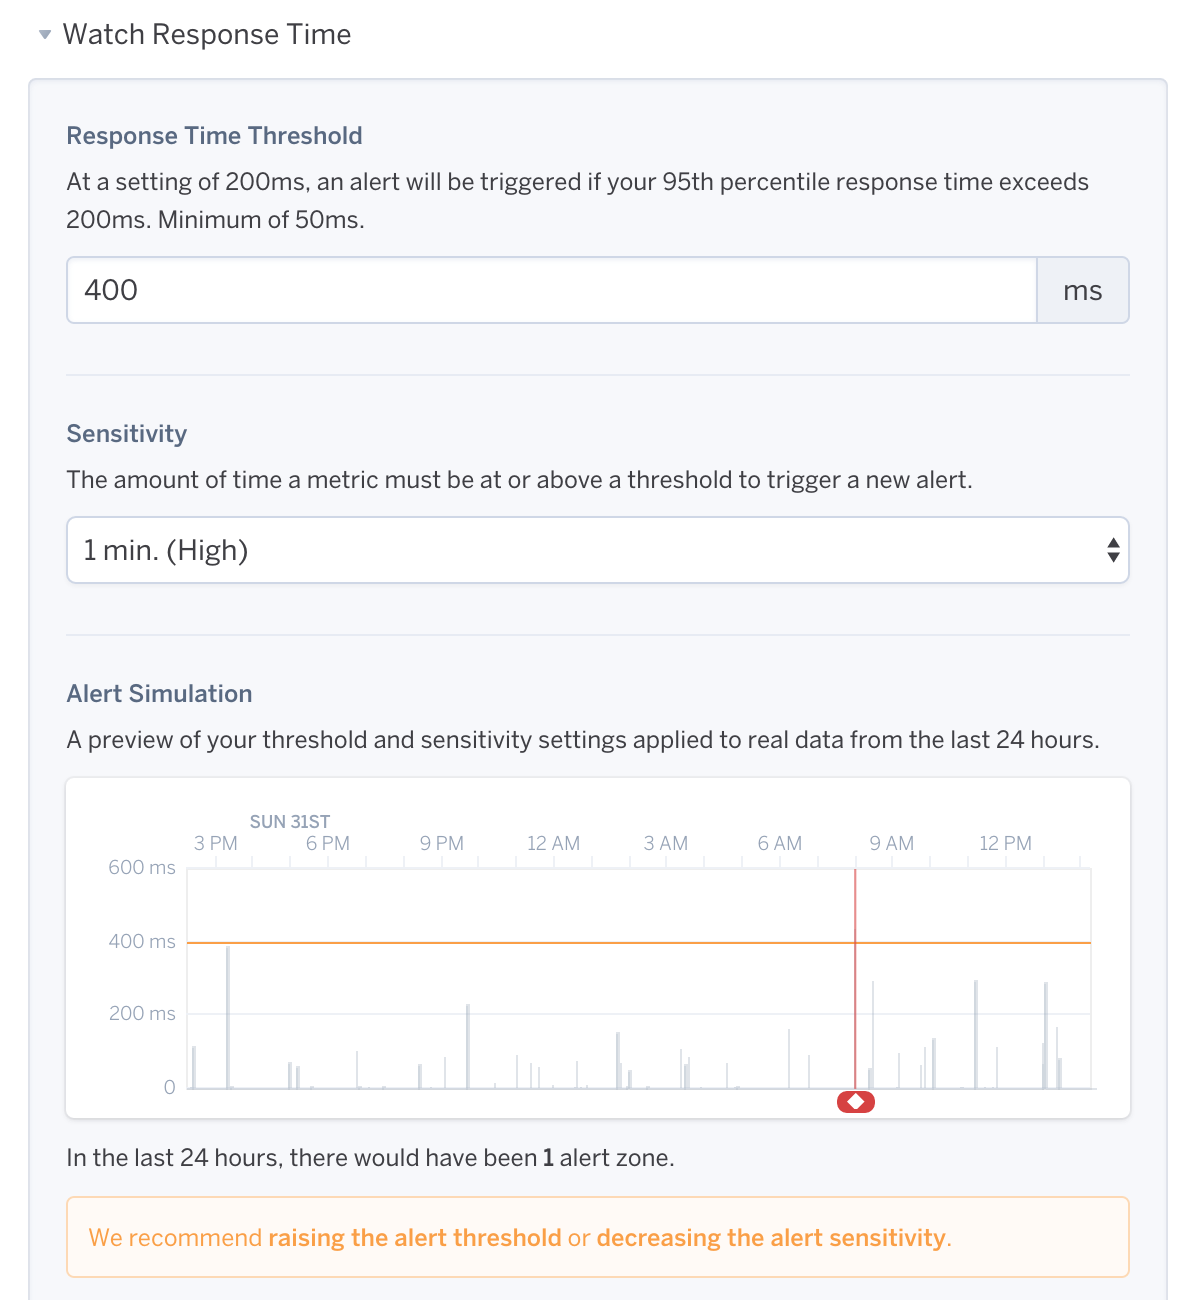
First, select a metric on which to alert such as response time. Then, enter the alerting Threshold (minimum response time is 50ms). Select the Sensitivity setting, i.e. the minimum time the threshold must be breached for an alert to be triggered. Options are High (1 minute), Medium (5 minutes), and Low (10 minutes). The Alert Simulation displays the alerts as they would appear based on the past 24 hours of your app’s data using the current threshold settings so that you can find a settings sweet-spot that won’t overwhelm your inbox.
Notifications Setup
The default distribution for email notifications is all app owners and collaborators for non-org accounts and admins for those in a Heroku Enterprise org. An additional email address, including email-based PagerDuty integration, is supported.
After configuring your alerts, you can specify the type(s) of email alert you wish to receive and the notification frequency (every 5 minutes, 1 hour, or 1 day), if applicable. Leaving both options unchecked results in dashboard alerts only. Lastly, activate your alert.

Dashboard Notifications
On the Application Metrics tab, alerts appear in both the Events table and on the corresponding plot.


Hobby Dyno Metrics
Traditionally, Hobby dynos had no access to the Application Metrics UI. Now basic metrics are available, providing data for the past 24 hours at 10-minute resolution. This includes errors, events, application guidance, response time, throughput, memory, and dyno load. Standard 1X dynos and above provide metrics data with up to 1-minute resolution for a two hour time period. Additionally, Hobby users will now be able to try out labs features that previously would have only been available to higher level dyno types. For Free dyno users considering an upgrade, Hobby dyno metrics and Heroku Teams are two great reasons.

Find Out More
For more details on both features refer to the Application Metrics Dev Center article.
If there’s an additional alerting metric or feature you would like to see, drop us a line at metrics-feedback@heroku.com. We also send out a user survey 1-2 times a year that helps drive our operational experience product roadmap. If would like to be notified send us your email, or watch the Metrics tab for a survey link.