
At Heroku, we’re focused on delivering thoughtfully designed systems to improve developer productivity and experience. We firmly believe that improving the development and operations experience helps developers to build and run better apps. This improvement allows developers to focus more on functionality, and businesses to focus more on the value of their applications.
Today we are pleased to announce two new features, both in public beta, that support this mission: a new Heroku Dashboard and Heroku Metrics. These new systems bring developers powerful new clarity and simplicity around application management, execution, and optimization.
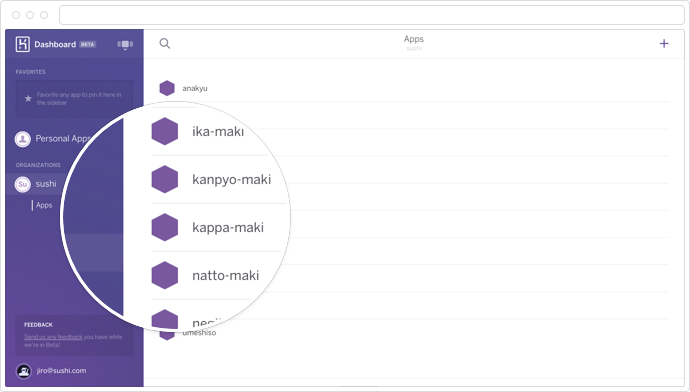
New Heroku Dashboard: Managing applications, organizations, and accounts via the web is now easier than ever.
Heroku Metrics: Monitoring production applications and understanding the relationships between runtime characteristics is now built into Heroku.
Both are live for you to begin using now.
New Heroku Dashboard
The management of applications, organizations, and accounts is a part of the development and scaling lifecycle. To make these actions more graceful and intuitive, we’ve developed an entirely new Dashboard for your use of Heroku.
Keeping things clear, fast, intuitive, and accessible is important to us, and we wanted the new Dashboard to embody those attributes. It had to be as responsive and reliable as a native application. To achieve this, we redesigned it from scratch and rebuilt it using Ember.js, creating a modern interface with ambitious layouts and interaction patterns.
Heroku should work with you, wherever you go. Whether you’re using Dashboard on your largest desktop display or the smallest of laptop screens, you’ll find the new layout brings the controls and data at your fingertips, and makes app- and org-switching speedy.
The new Dashboard also gives you the ability to explore changes to your application in a safer manner. We converged on a view-first pattern in order to shield you from accidental changes with potential operational impact, like scaling or resource deletion. With this new interaction mode, you explicitly toggle into edit-mode before you can make modifications to your apps.

We took the opportunity presented by this functional redesign to develop a new visual design, as well. We crafted a more friendly and approachable style, to lighten the load of web application development. The result is a lighter interface that favors content over chrome.
To get started with the new Dashboard, head to dashboard.heroku.com. During the beta, you may need to visit the old Dashboard to complete some administrative tasks; you can switch between the two at any time. When the new Dashboard is GA later this year all of the old functionality will be ported over.
Heroku Metrics
Managing applications through development and scaling often requires a deeper understanding of performance and resource utilization. A seamless part of the new Dashboard, our new Heroku Metrics system is designed to give you just that understanding, making it simple for you to analyze and optimize performance of your applications on Heroku.
In order to provide clarity and general visibility into your applications’ performance and behavior, the new Metrics system provides a unified view of the data most relevant to tuning and scaling your application. Now you have direct visibility of these performance characteristics:
Throughput: One of the most important characteristics to measure on a web process is its throughput. Heroku Metrics provides requests per minute segmented by HTTP status codes (OK vs. Failed) per time period.
Response Time: The response time of your application is also a key measure of system health and quality of service. The Metrics dashboard provides both the median and 95th percentile response times per time period.
Errors: Platform error codes can provide excellent insight into issues with your application, so the Metrics system interpolates them with the rest of your time series data for better understanding of causality.
Memory: Visibility into the memory utilization of your application is useful when assessing capacity, finding memory leaks, or identifying performance degradation due to swap.
CPU Load: CPU load is another critical component of performance monitoring, especially for applications with processing intensive workloads, or high levels of in-process parallelism.
By unifying the display of this data along a consistent time axis, and by representing the data in the manner most meaningful for each metric, the framework provides more visibility into the interaction of these parameters and the relationships between them. This should offer a more intuitive way to understand and tune the overall performance of your app.
As we gather more data and feedback, we will be introducing guidance around performance optimization, including recommendations on horizontal or vertical scaling of applications. This guidance will be based on heuristics we are currently modeling from the range of applications on the platform. We will be rolling these out soon, and improving them as we go.
In order to get started with Heroku Metrics, visit dashboard.heroku.com and select the Metrics tab for one of your applications. The Metrics feature is enabled only for applications with more than one running dyno, where performance tuning is likely to be more of a priority.
Existing applications should have some period of metrics already available in the system, while newly created applications or applications with recently added process types should see data available in the Metrics view within about an hour of the update. For details on the metrics displayed, see the documentation in Dev Center.
Feedback and Availability
We hope you enjoy the features we are making available today, and encourage any feedback you have on them as we work towards General Availability later this fall.