** THIS FEATURE IS NOW DEFUNCT **
If you’re building a customer-facing web app or mobile back-end, performance is a critical part of user experience. Fast is a feature, and affects everything from conversion rates to your site’s search ranking.
The first step in performance tuning is getting visibility into the app’s web performance in production. For this, we turn to the app’s logs.
Logs as data
There are many ways to collect metrics, the most common being direct instrumentation into the app. New Relic, Librato, and Hosted Graphite are cloud services that use this approach, and there are numerous roll-your-own options like StatsD and Metrics.
Another approach is to send metrics to the logs. Beginning with the idea that logs are event streams, we can use logs for a holistic view of the app: your code, and the infrastructure that surrounds it (such as the Heroku router). Mark McGranaghan’s Logs as Data and Ryan Daigle’s 5 Steps to Better Application Logging offer an overview of the logs-as-data approach.
Put simply, logs as data means writing semi-structured data to your app's logs via STDOUT. Then the logs can be consumed by one or more services to do dashboards, long-term trending, and threshold alerting.
The benefits of logs-as-data over direct instrumentation include:
- No additional library dependencies for your app
- No CPU cost to your dyno by in-app instrumentation
- Introspection capability by reading the logs directly
- Metrics back-ends can be swapped out without changes to app code
- Possible to split the log stream and send it to multiple back-ends, for different views and alerting on the same data
Introducing log2viz, a public experiment
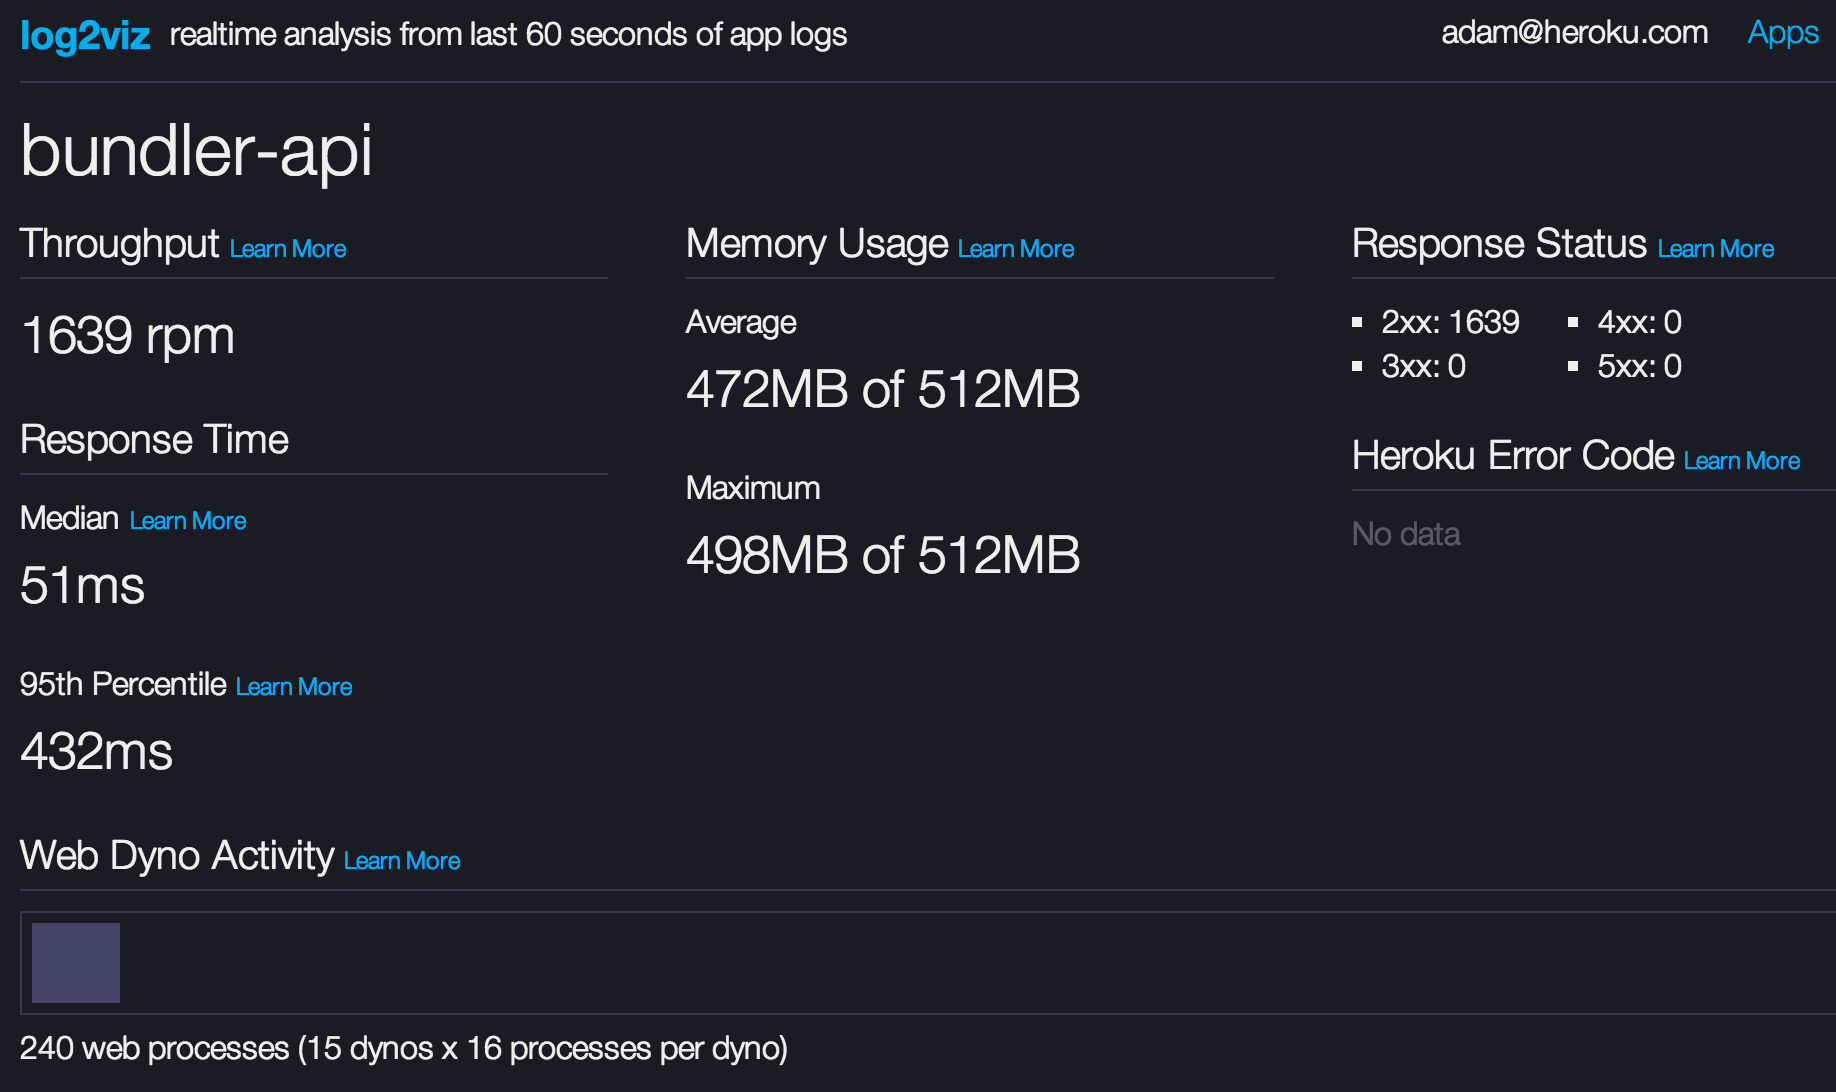
log2viz is an open-source demonstration of the logs-as-data concept for Heroku apps. Log in and select one of your apps to see a live-updating dashboard of its web activity.
For example, here’s a screenshot of log2viz running against the Rubygems Bundler API (written and maintained by Terence Lee, André Arko, and Larry Marburger, and running on Heroku):

log2viz gets all of its data from the Heroku log stream — the same data you see when running heroku logs --tail at the command line. It requires no changes to your app code and works for apps written in any language and web framework, demonstrating some of the benefits of logs as data.
Also introducing: log-runtime-metrics
In order to get memory use stats for your dynos, we’ve added a new experimental feature to Heroku Labs to log CPU and memory use by the dyno: log-runtime-metrics.
To enable this for your app (and see memory stats in log2viz), type the following:
$ heroku labs:enable log-runtime-metrics -a myapp
$ heroku restart
This inserts data into your logs like this:
heroku[web.1]: measure=load_avg_5m val=0.0
heroku[web.1]: measure=memory_total val=209.64 units=MB
log2viz reads these stats and displays average and max memory use across your dynos. (Like all Labs features, this is experimental and the format may change in the future.)
Looking under the hood
log2viz is open source. Let’s look at the code:
- It uses OAuth via
heroku-bouncerto connect to your Heroku account and make API calls to access information about your apps. - It reads from your app's log stream. This is the same API endpoint that the Heroku CLI connects to when you run
heroku logs --tail. - It's written in Ruby and uses the Sinatra streaming API (an EventMachine implementation of Server-sent Events) to handle both the incoming log data and outgoing live updates to the user's browser.
- It uses the Heroku API when you connect to the page to fetch the app's name and number of web dynos. It takes a hint for concurrency per dyno based on the
WEB_CONCURRENCYconfig var. - All of the metrics are derived from 60 seconds of data, stored in-memory in the user’s browser. (Storing historical data would enable trend analysis, but we chose to leave that out of scope for this experiment.)
- log2viz only subscribes to the app’s logs while the page is open in your browser. Closing the window also closes the log connection.
You can deploy your own copy of log2viz on Heroku, so fork away! For example, Heroku customer Timehop has experimented with trending graphs via Rickshaw.
Logs-as-data add-ons
log2viz isn't the only way to take advantage of your log stream for visibility on Heroku today. Here are a few add-ons which consume your app's logs.
Loggly offers a web console that lets you search your log history, and graph event types over time. For example, let’s search for status=404, logged by the Heroku router whenever your app serves a page not found:

Papertrail offers search archival and history, and can also alert on events when they pass a certain threshold. Here’s how you can set up an email alert every time your app experiences more than 10 H12 errors in a 60 second period. Search for the router log line:

Click “Save Search,” then:

Other add-ons that consume logs include Treasure Data and Logentries.
You can also use non-add-on cloud services, as shown in thoughtbot's writeup on using Splunk Storm with Heroku.
Conclusion
Visibility is a vast and challenging problem space. The logs-as-data approach is still young, and log2viz is just an experiment to get us started. We look forward to your feedback on log2viz, log visibility via add-ons, and your own experiments on performance visibility.