
Pushing an app to the cloud can feel like launching a probe into space. Once your project is thousands of miles away you can't bang on it with a hammer or replace broken parts when there's a problem. Your debugging efforts must rely on the instrumentation, telemetry, and remote controls included with the app when it was deployed. On Heroku, we've gladly done some of that prep work for you.
Two new Heroku features, Heroku Exec and Language Runtime Metrics, improve your production monitoring, inspecting, and debugging experience on the platform. With Heroku Exec, you can create secure TCP and SSH tunnels into a dyno, which facilitate SSH sessions, port forwarding, remote debugging, and most popular diagnostic tools. Our Language Runtime Metrics feature supplements these tools by displaying detailed time series metrics in your Heroku dashboard.
You can try Heroku Exec right now by running the following command on any Heroku app:
$ heroku ps:exec
Establishing credentials... done
Connecting to web.1 on ⬢ evening-lowlands-62983...
~ $
This creates an SSH session into a running dyno, which makes it possible to inspect your application's Java process with commands like jstat and jcmd. To make this even easier, we've integrated the most popular tools, including jmap and VisualVM, directly into the Heroku CLI so you can run commands such as heroku java:jmap to get a heap dump from a dyno.
Let's take a closer look at how you can use these features to debug real production problems by testing them on a Java application with a memory leak.
Inspecting an App with the Heroku Java CLI
You can follow the steps in this section with your own Java app running on Heroku, or you can use the sample app we've created, which includes a synthetic memory leak. You'll use the Heroku Java CLI to inspect the process with VisualVM and other diagnostic tools to identify the source of the leak.
Make sure you have a Heroku account and have installed the Heroku CLI, then run the following commands to deploy the sample app:
$ git clone https://github.com/kissaten/java-memory-leak
$ cd java-memory-leak
$ heroku create
$ git push heroku master
Open the app in a browser by running:
$ heroku open
The page will tell you exactly how much memory has been leaked, and it will grow each time you refresh. Unfortunately, most real-world leaks are not this polite, and must be uncovered with monitoring tools. The Java Development Kit (JDK) comes bundled with several of these tools, a few of which are integrated into the Heroku Java CLI. To start, install the Java CLI plugin by running this command:
$ heroku plugins:install heroku-cli-java
Now use the CLI to connect a local VisualVM session, a lightweight profiler for the Java virtual machine, to your remote Heroku dyno by running:
$ heroku java:visualvm
The command will create the connection and open VisualVM. You can see a demonstration in this video:
Refresh your app's web page a few times. As the memory leak grows, you'll also see the process's heap memory grow in VisualVM. This helps you identify that the leak is confined to heap memory as opposed to off-heap memory. But it doesn't narrow down the objects at the source of the growth. For that, you can use the jmap command like this:
$ heroku java:jmap --hprof
Establishing credentials... done
Generating heap dump for web.1 on ⬢ pure-tor-76648...
Dumping heap to /app/heapdump-5865f5e1-956a-4f60-8d66-8571b645a950.hprof ...
Heap dump file created
Downloading... ████████████████████████▏ 100% 00:00
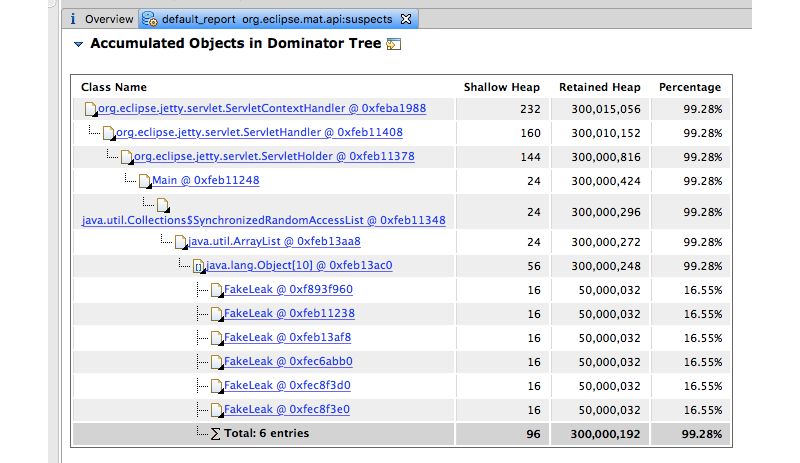
This downloads a binary heap dump from the dyno, which can then be imported into tools like Eclipse Memory Analyzer (MAT) for analysis. Indeed, when you open the HPROF file in Eclipse MAT, its leak suspects report correctly identifies that the Servlet is holding on to some very large FakeLeak objects:
Eclipse MAT, VisualVM, and jmap are great when you know you have a problem, but they are not tools you'll want to run continuously. For passive metrics monitoring, you need a low-overhead, zero-fuss solution.
Monitoring a Production App with Heroku JVM Metrics
The Heroku Language Runtime Metrics feature gathers detailed performance information from your application process and displays it in the Heroku Dashboard. This differs from our existing application metrics, which are gathered from the operating system and the Heroku platform. An application process's runtime can report more specific metrics, such as heap memory use and garbage collection activity, which provide better visibility into how your code is working.
To enable this feature, you'll first need to upgrade to a paid, Standard or above, dyno. Then add the Heroku Metrics buildpack to your app by running the following commands:
$ heroku buildpacks:add -i heroku/metrics
Finally, make an empty commit to your application, and redeploy:
$ git commit --allow-empty -m "Add Heroku Metrics Buildpack"
$ git push heroku master
Browse to the Heroku Dashboard for your application, and view the Metrics tab. Below the standard memory and dyno load charts, you'll see the JVM metrics:

These charts display heap memory (memory used for each object your program creates), non-heap memory (which includes Metaspace and buffer pools), and garbage collection activity. The metrics are reported by a small Java agent that Heroku attaches to your application process. This agent uses Prometheus, an open-source systems monitoring and alerting toolkit. We've chosen Prometheus because it's mature, has an active community, and is independent open-source project governed by the Cloud Native Computing Foundation.
Heroku Language Metrics support for JVM languages is generally available, and support for Go is in beta. We'll have more languages coming soon.
Bring Your Java Apps Down to Earth
Your app may be physically running on servers in another country or continent, but that doesn't mean you have to forgo the tooling that helps you solve problems. We're lucky to have such excellent monitoring and debugging tools in the Java ecosystem, and at Heroku we're happy to make them easily available for you.
For more information on the Heroku Java CLI, see the Heroku Exec article in Dev Center. For more information on JVM Runtime Metrics, see the Language Runtime Metrics article in Dev Center.