
Building a SaaS product, a system to handle sensor data from an internet-connected thermostat or car, or an e-commerce store often requires handling a large stream of product usage data, or events. Managing event streams lets you view, in near real-time, how users are interacting with your SaaS app or the products on your e-commerce store; this is interesting because it lets you spot anomalies and get immediate data-driven feedback on new features. While this type of stream visualization is useful to a point, pushing events into a data warehouse lets you ask deeper questions using SQL.
In this post, we’ll show you how to build a system using Apache Kafka on Heroku to manage and visualize event streams from any type of data producer. We’ll also see how you can build consumers that can push those event streams from Heroku into Amazon Redshift for further analysis using Metabase, an open source product analytics tool.
System Overview
This is an example system that captures a large stream of product usage data, or events, to provide both real-time data visualization and SQL-based data analytics. The system uses a simple Node.js app deployed to Heroku called generate_data to simulate usage data for an e-commerce store, but this could be replaced with almost anything that produces data: a marketing website, a SaaS product, a point-of-sale device, a kiosk, an internet-connected thermostat or car. And more than one data producer can be added.
generate_data1 is an app that produces a stream of events into an Apache Kafka cluster managed by Heroku. The event stream is then available to other downstream consumers. Apache Kafka is an append-only immutable event log and the leading open source project for managing billions of events.
In our example system, there are two apps that are downstream consumers of the data. A web-based data visualization app running on Heroku, viz1, allows viewing the data flowing through Kafka in near real-time. viz shows the relative volume of product data being written into Kafka. The other Heroku app, reshift_batch1, consumes events from Kafka and stores all the data in RedShift, which Amazon describes as "a fast, fully-managed, petabyte-scale data warehouse."
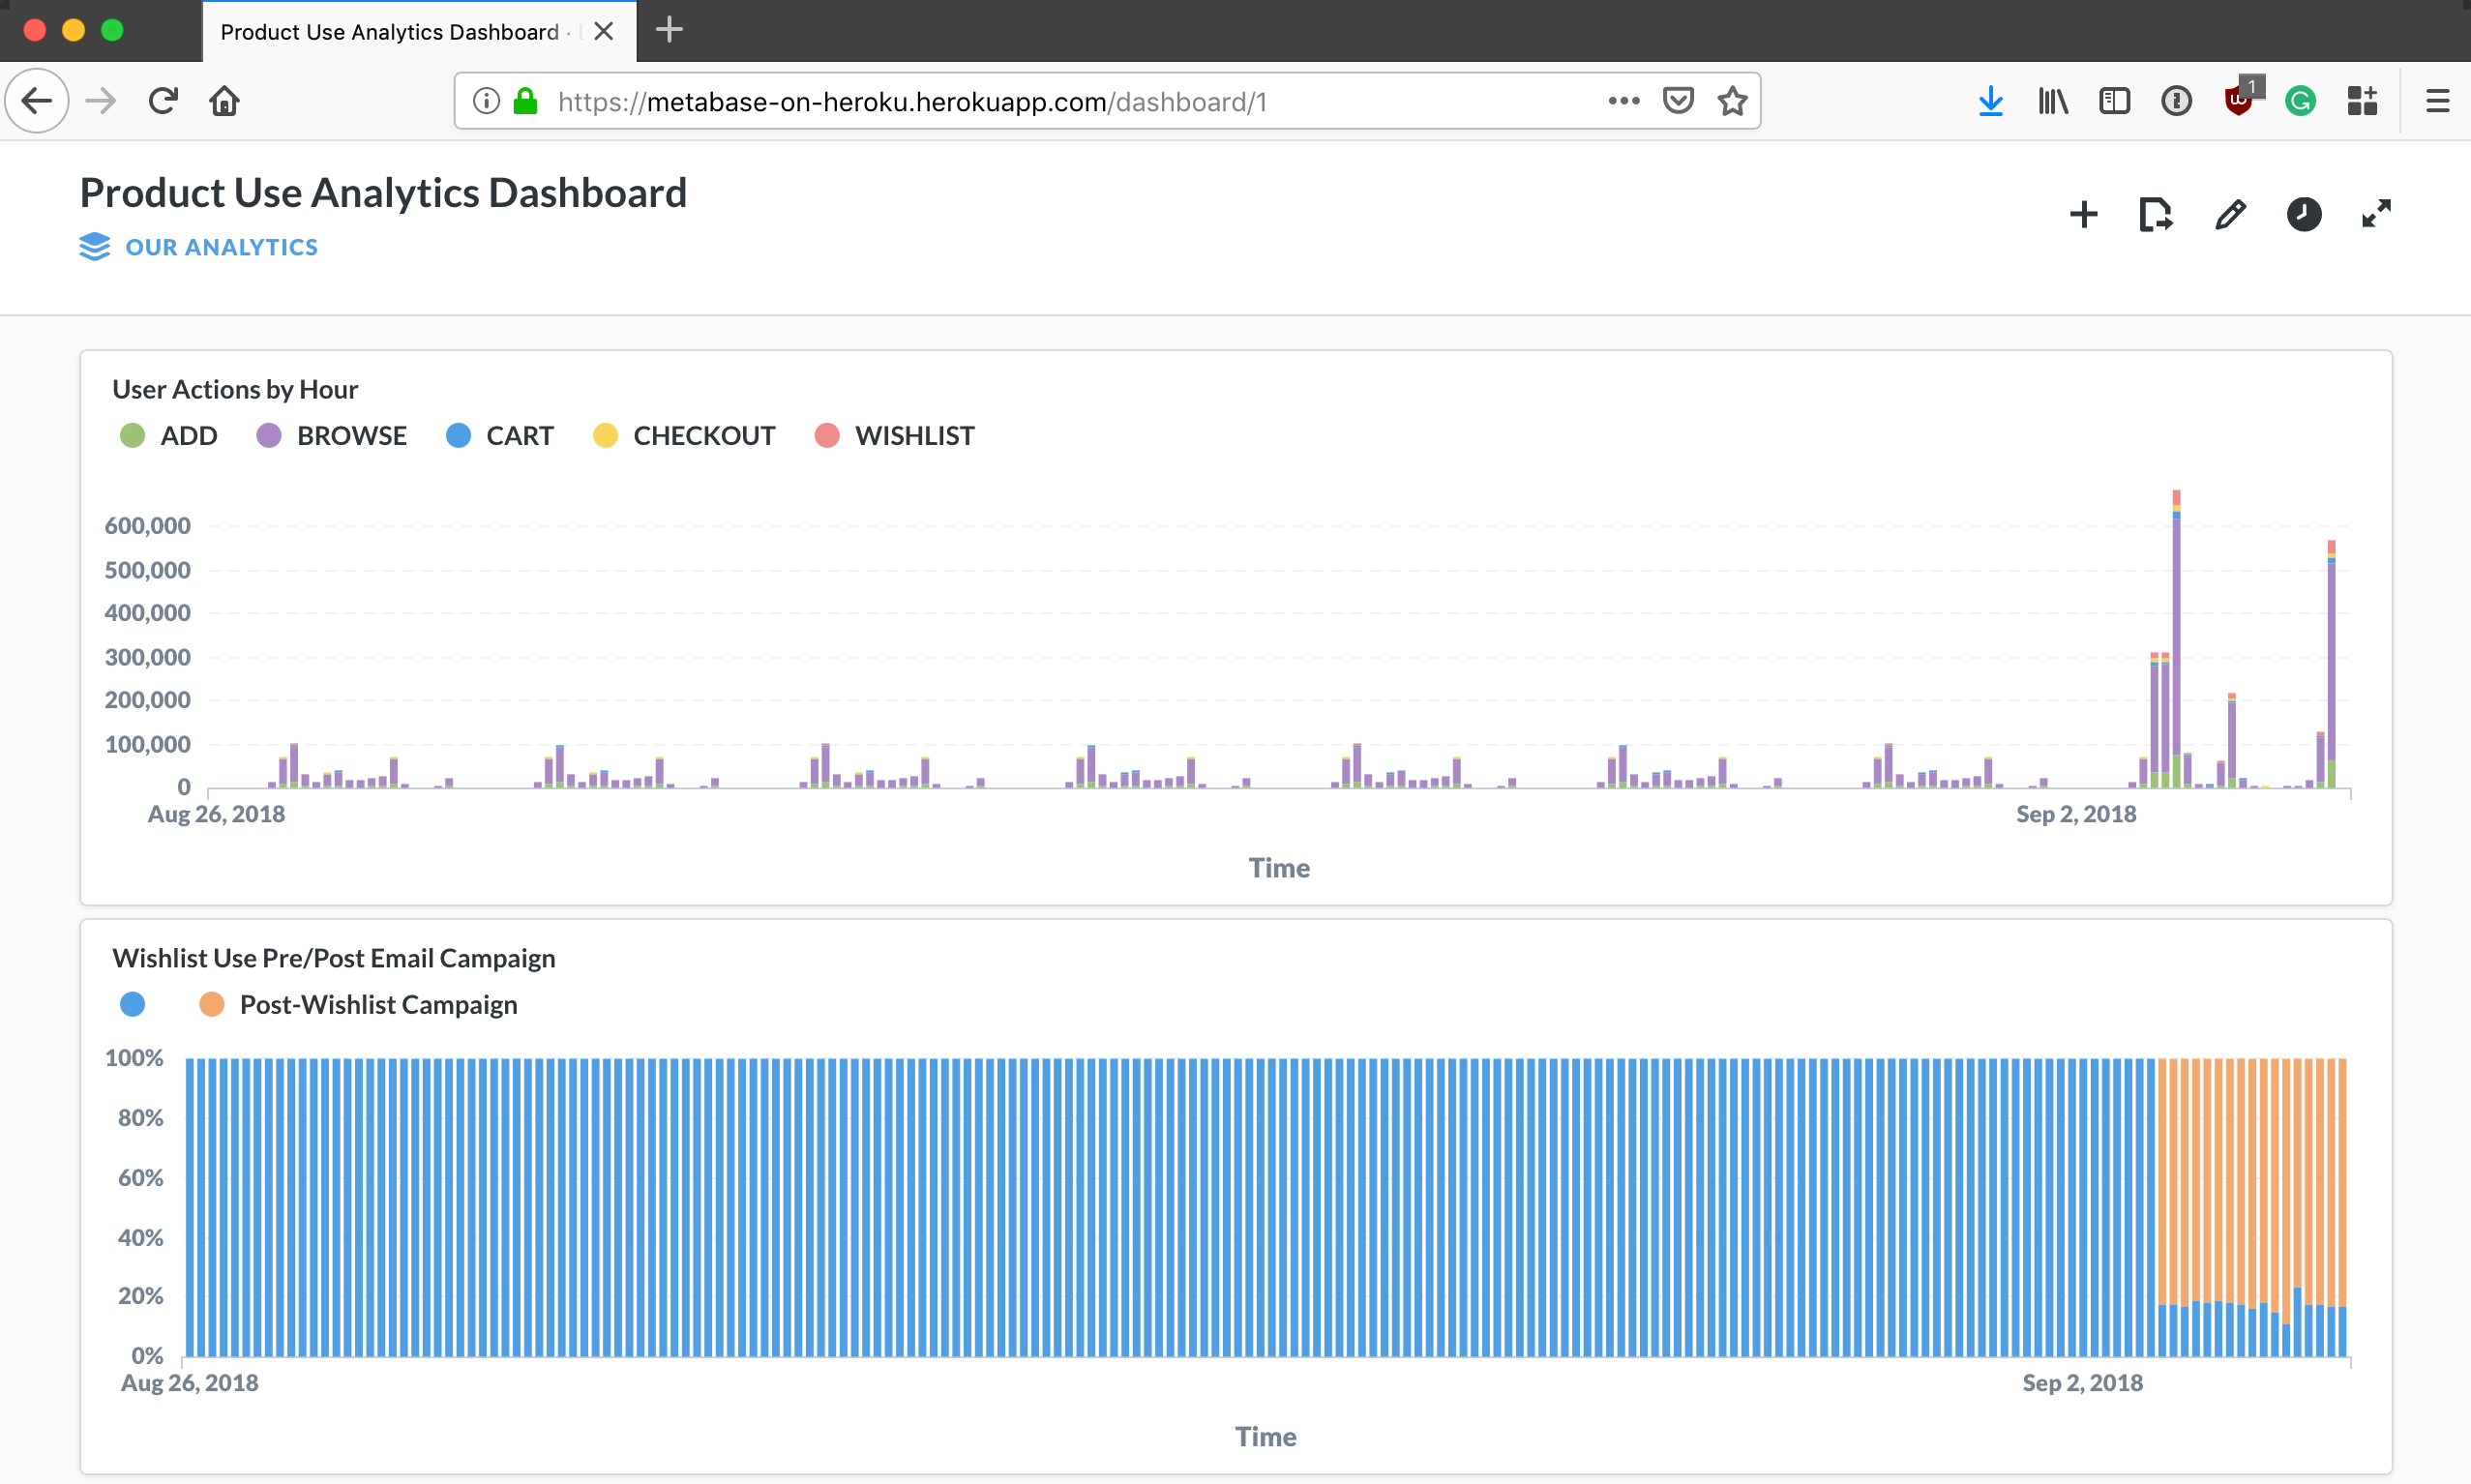
Once the data is in Redshift, we can write ad-hoc queries and visualize the data using trend analysis and data dashboards using a SQL-compliant analytics tool. This example uses Metabase deployed to Heroku. Metabase is an open-source analytics tool used by many organizations, large and small, for business intelligence. It has many similar capabilities as Tableau or Looker.
Managing Event Streams with Apache Kafka & Node.js
To get this system up and running we first need to simulate our product usage events. To do this we’ve created a simple Node.js app generate_data. generate_data bootstraps a batch ShoppingFeed of simulated events that represents user interactions on our fictitious website such as adding a product to a wishlist or shopping cart. Since we’re generating millions of events we’ll use Kafka to manage all of these events.
generate_data sends each product data event to the configured Kafka topic on a single partition using no-kafka, an open source Kafka client for Node.js.
  const producer = new Kafka.Producer(config.output.kafka);
  let ended = 0;
  let sf = null;

  const handleOutput = (event) => {
    producer.send({
      topic: config.output.topic,
      message: { value: JSON.stringify(event) },
      partition: 0
    })
      .then((r) => {
      })
    .catch((e) => {
      console.log(e);
      throw e;
    });
  };
To try this yourself, first get the source.
$ git clone git@github.com:heroku-examples/analytics-with-kafka-redshift-metabase.git
Cloning into 'analytics-with-kafka-redshift-metabase'...
remote: Enumerating objects: 1192, done.
remote: Counting objects: 100% (1192/1192), done.
remote: Compressing objects: 100% (548/548), done.
remote: Total 1192 (delta 635), reused 1135 (delta 586), pack-reused 0
Receiving objects: 100% (1192/1192), 2.27 MiB | 1005.00 KiB/s, done.
Resolving deltas: 100% (635/635), done.
$ cd analytics-with-kafka-redshift-metabase
Then create an empty Heroku app and provision a fully-managed Kafka cluster on Heroku (this takes just a few seconds for a multi-tenant plan and less than 10 minutes for a dedicated cluster) to the app; once provisioned, create a topic called ecommerce-logs where we will send all of our events and then deploy the sample codebase to your Heroku app. Notice we also created a consumer group for later use by downstream consumers.
$ heroku create
$ heroku addons:create heroku-kafka:basic-0
$ heroku kafka:topics:create ecommerce-logs
$ heroku kafka:consumer-groups:create redshift-batch
$ heroku config:set KAFKA_TOPIC=ecommerce-logs
$ heroku config:set KAFKA_CONSUMER_GROUP=redshift-batch
$ git push heroku master
You’ll also need to ensure your app's environment variables are set via config vars in Heroku: Kafka topic, cluster URL, and client certificates. This is all done for you if you follow the directions above. Note: using Apache Kafka will incur costs on Heroku.
Real-time Stream Visualization
Given the holidays are fast approaching, let’s visualize the usage of the ‘wishlist’ feature of our fictitious store in near real-time by our users. Why might we want to do this? Let’s say the marketing team wants to drive engagement leading to more sales by promoting the wishlist feature—as the product development team, we’d like to give them the ability to see if users are responding as soon as the campaign goes out, both for validation but also to detect anomalies.
To do this we’ll use the viz app mentioned earlier to consume events from Kafka that represent adds to the wishlist and display the average volume by product category in a D3 stacked, stream chart. If a product category were missing from the wishlist, we could easily see it below and dig deeper to find the source of the error.
Underneath the hood viz is just a Node.js Express app listening to Kafka and passing the events out on a WebSocket; we use a Simple Kafka Consumer from no-kafka to consume events from the same topic we produced to earlier with generate_data.
    this._consumer = new Kafka.SimpleConsumer({
      idleTimeout: this._interval,
      connectionTimeout: 10 * 1000,
      clientId: topic,
      ...consumer
    })
We can then broadcast events to the WebSocket server for visualization.
  init() {
    const { _consumer: consumer } = this
    const { clientId: topic } = consumer.options

    return consumer
      .init()
      .then(() => consumer.subscribe(topic,this.onMessage.bind(this)))
      .then(() => setInterval(this.cullAndBroadcast.bind(this), this._interval))
  }
Real-time Product Analytics Using Amazon Redshift and Metabase
While the ability to visualize how our users are interacting with our app in real-time using event streams is nice, we need to be able to ask deeper questions of the data, do trend and product analysis, and provide our business stakeholders with dashboards.
With Kafka, we can easily add as many consumers as we like without impacting the scalability of the entire system and preserve the immutability of events for other consumers to read. When we deployed our example system earlier we also deployed redshift_batch, a Simple Kafka Consumer that uses consumer groups that allows us to horizontally scale consumption by adding more dynos (containers).
redshift_batch has a few simple jobs: consume events, send those events to Amazon Redshift for datawarehousing, and then commit the offsets of messages it has successfully processed. Connecting and writing to Redshift from Heroku is simply a matter of using pg-promise—an interface for PostgreSQL built on top of node-postgres—with a DATABASE_URL environment variable. You’ll also need to create the table in Redshift to receive all the events.
const db = Postgres(Config.database);
db.connect();
const ecommTable = new Postgres.helpers.ColumnSet(['time', 'session', 'action', 'product', 'category', 'campaign'], {table: 'ecommercelogs'});

const consumer = new Kafka.SimpleConsumer({
  ...Config.kafka.config,
  groupId: Config.kafka.group
});

let queue = [];
let lastUpdate = performance.now();
let lock = false;

const dataHandler = (messageSet, topic, partition) => {
  messageSet.forEach((msg) => {
    const now = performance.now();
    const sinceLast = now - lastUpdate;
    const value = JSON.parse(msg.message.value);
    const offset = msg.offset;
    const length = queue.push(value);
    if (lock === false && (length >= Config.queueSize || sinceLast > Config.timeout)) {
      console.log(queue.length);
      lock = true;
      lastUpdate = now;
      const query = Postgres.helpers.insert(queue, ecommTable);
      db.query(query, queue)
        .then((data) => {
          return consumer.commitOffset({ topic, partition, offset });
        })
        .then(() => {
          lock = false;
          console.log('unlock');
        })
        .catch((err) => {
          lock = false;
          console.log(err);
        });
      queue = [];
    }
  });
};


consumer.init().then(() => {
  consumer.subscribe(Config.kafka.topic, dataHandler);
});
Note for all this to work you’ll need an Amazon Redshift cluster and a few other resources; check out this Terraform script for an automated way to create a RedShift cluster along with a Heroku Private Space and a private peering connection between the Heroku Private Space and the RedShift's AWS VPC. Note: this will incur charges on AWS and Heroku, and requires a Heroku Enterprise account.
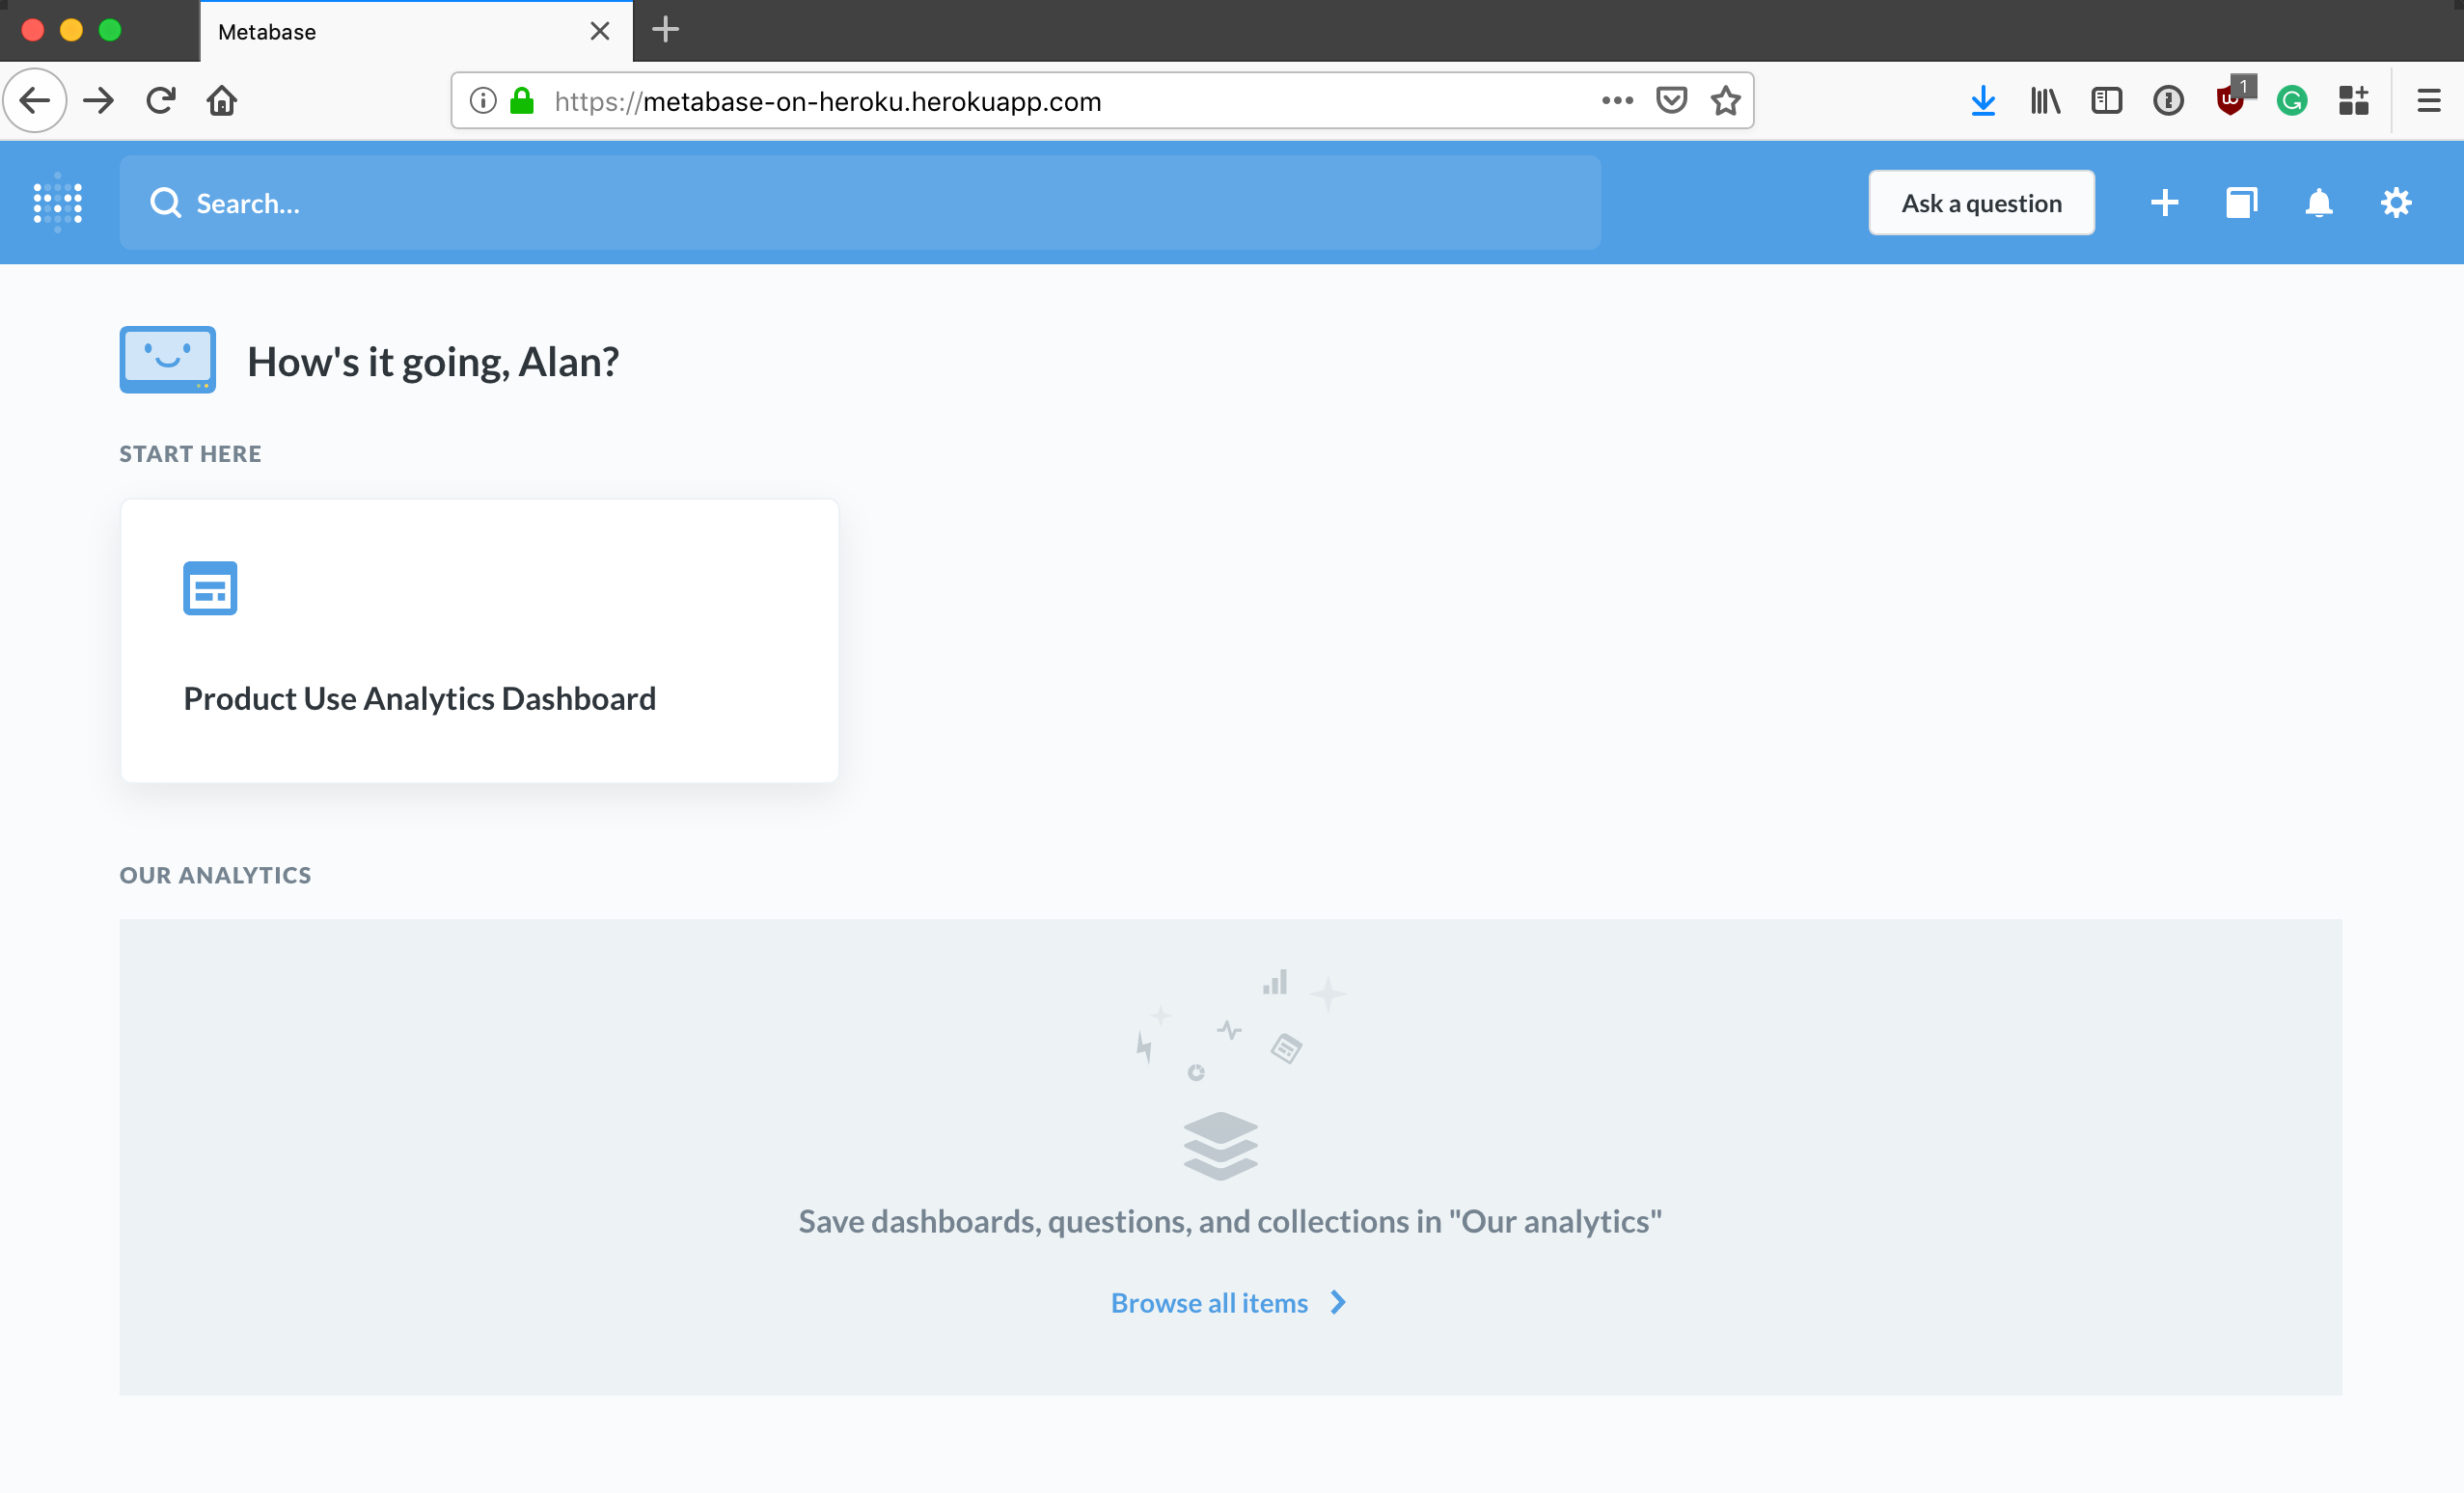
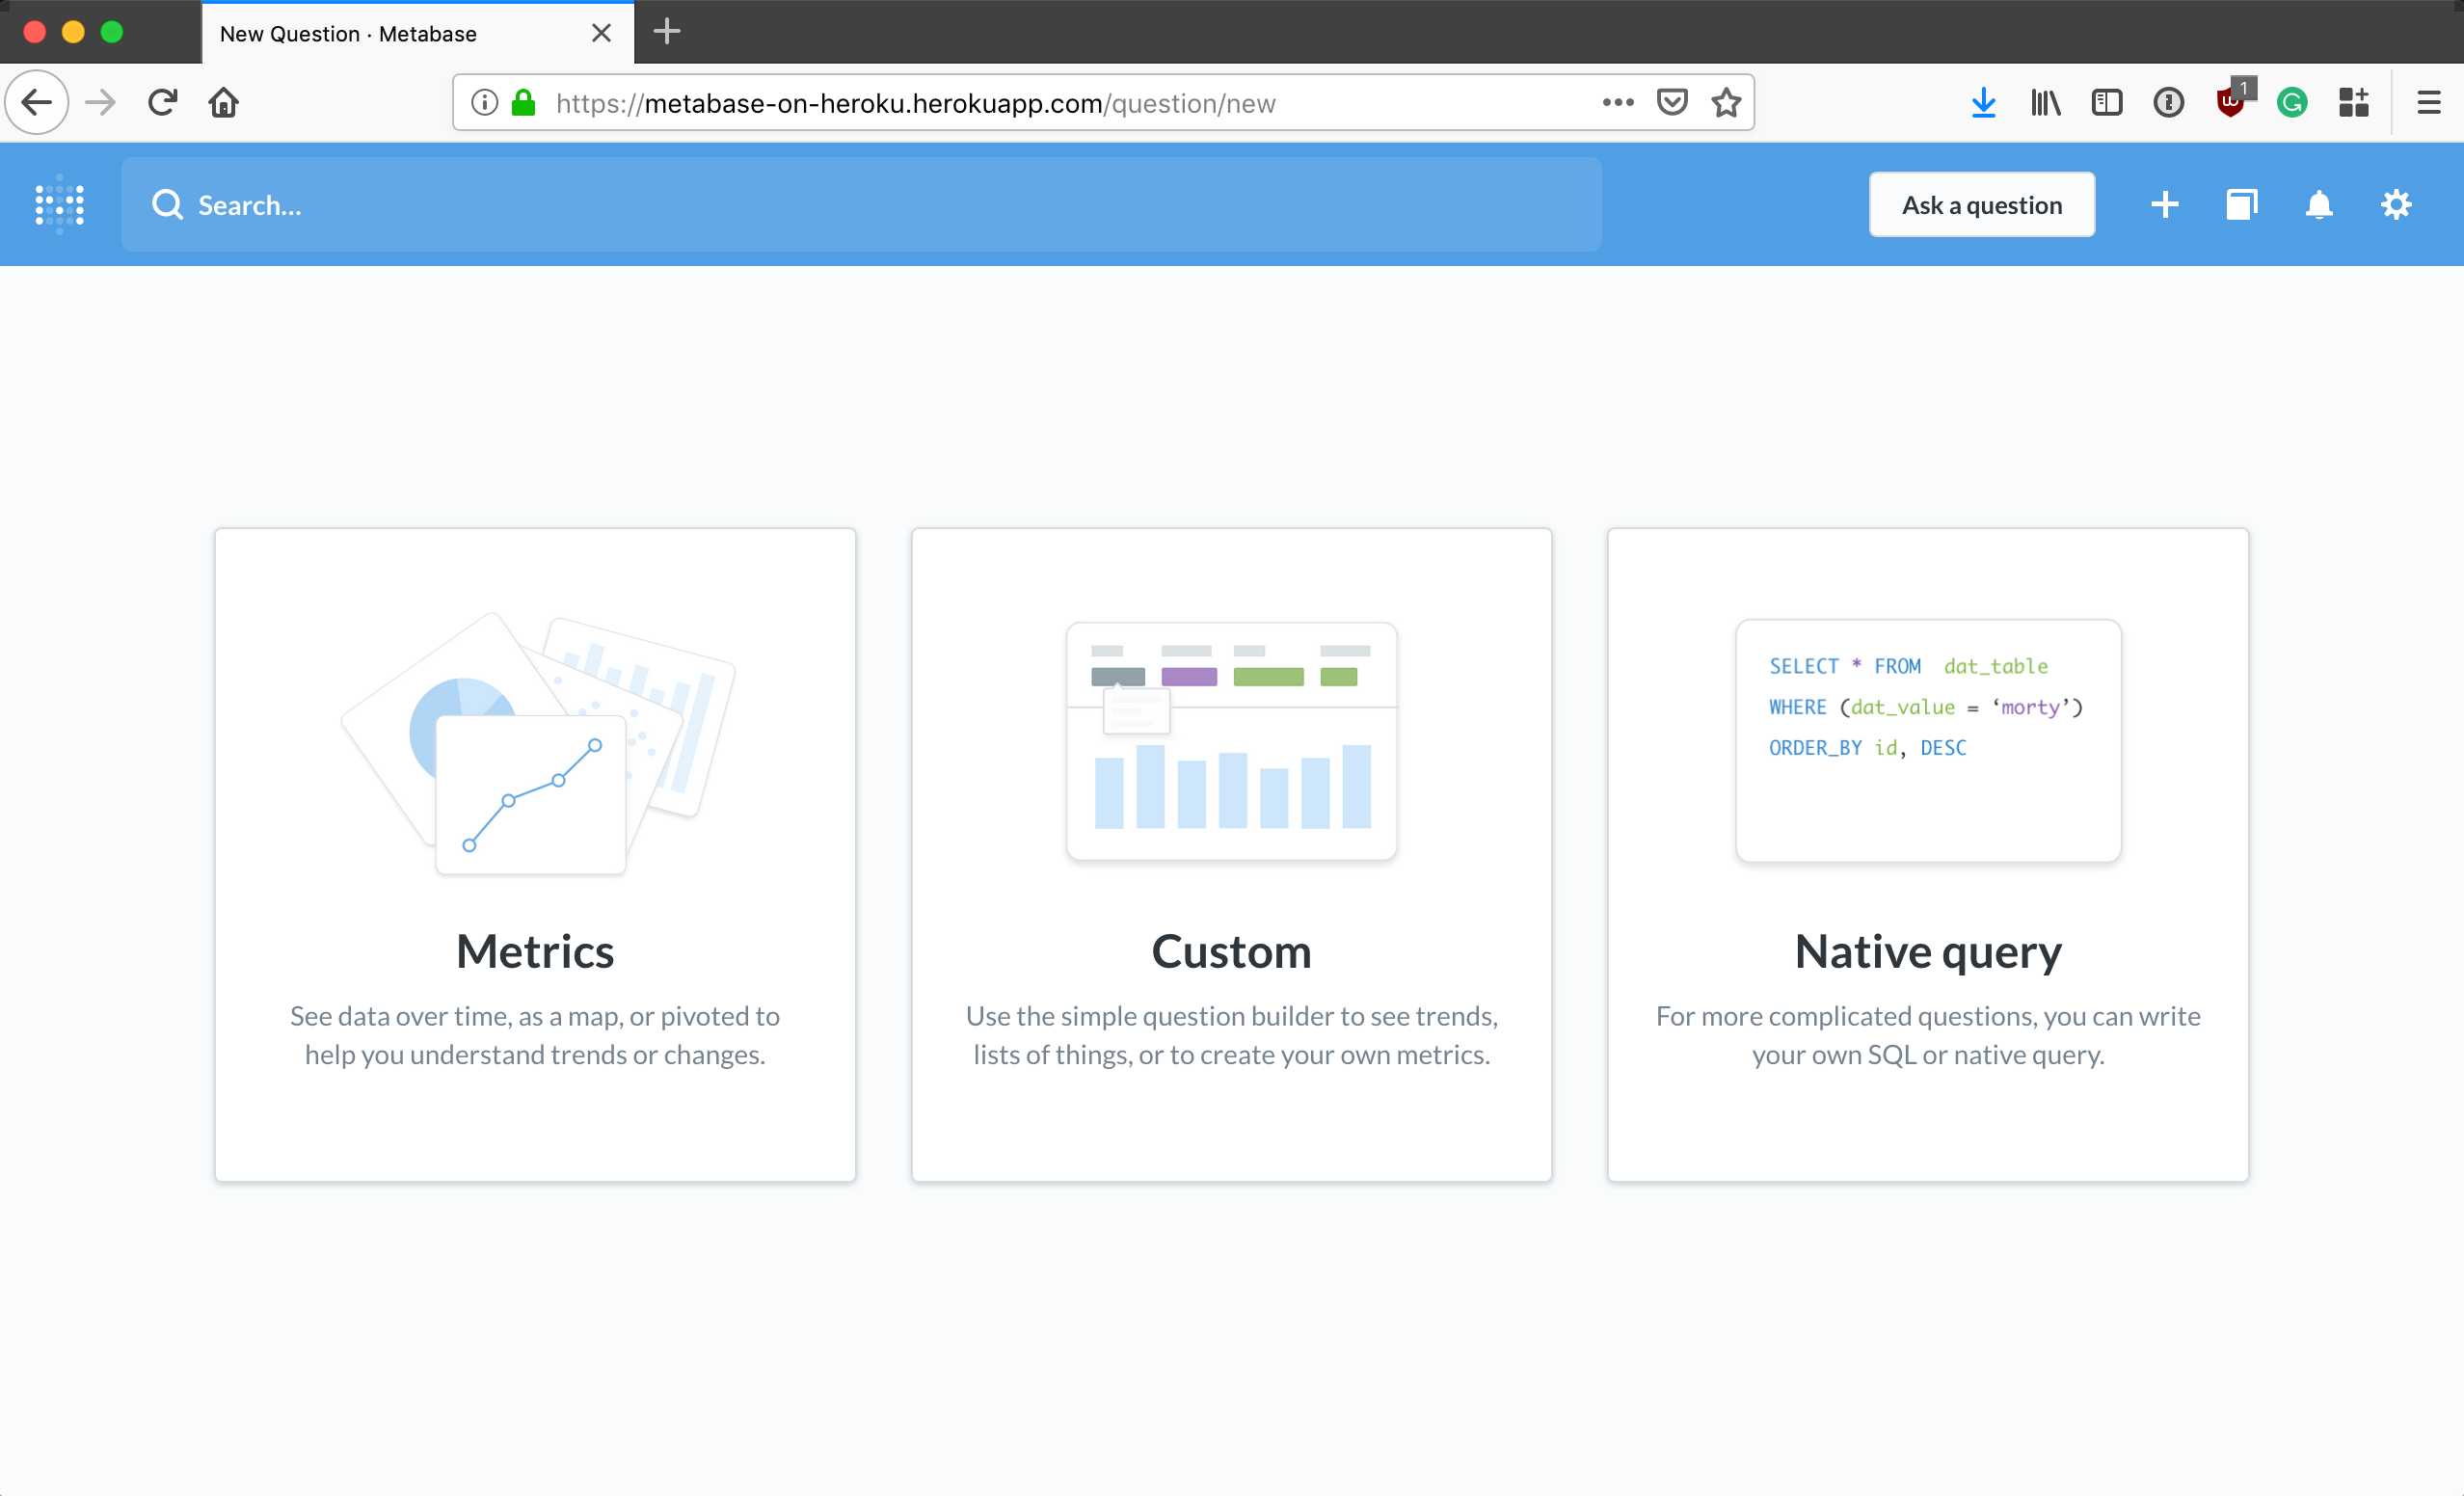
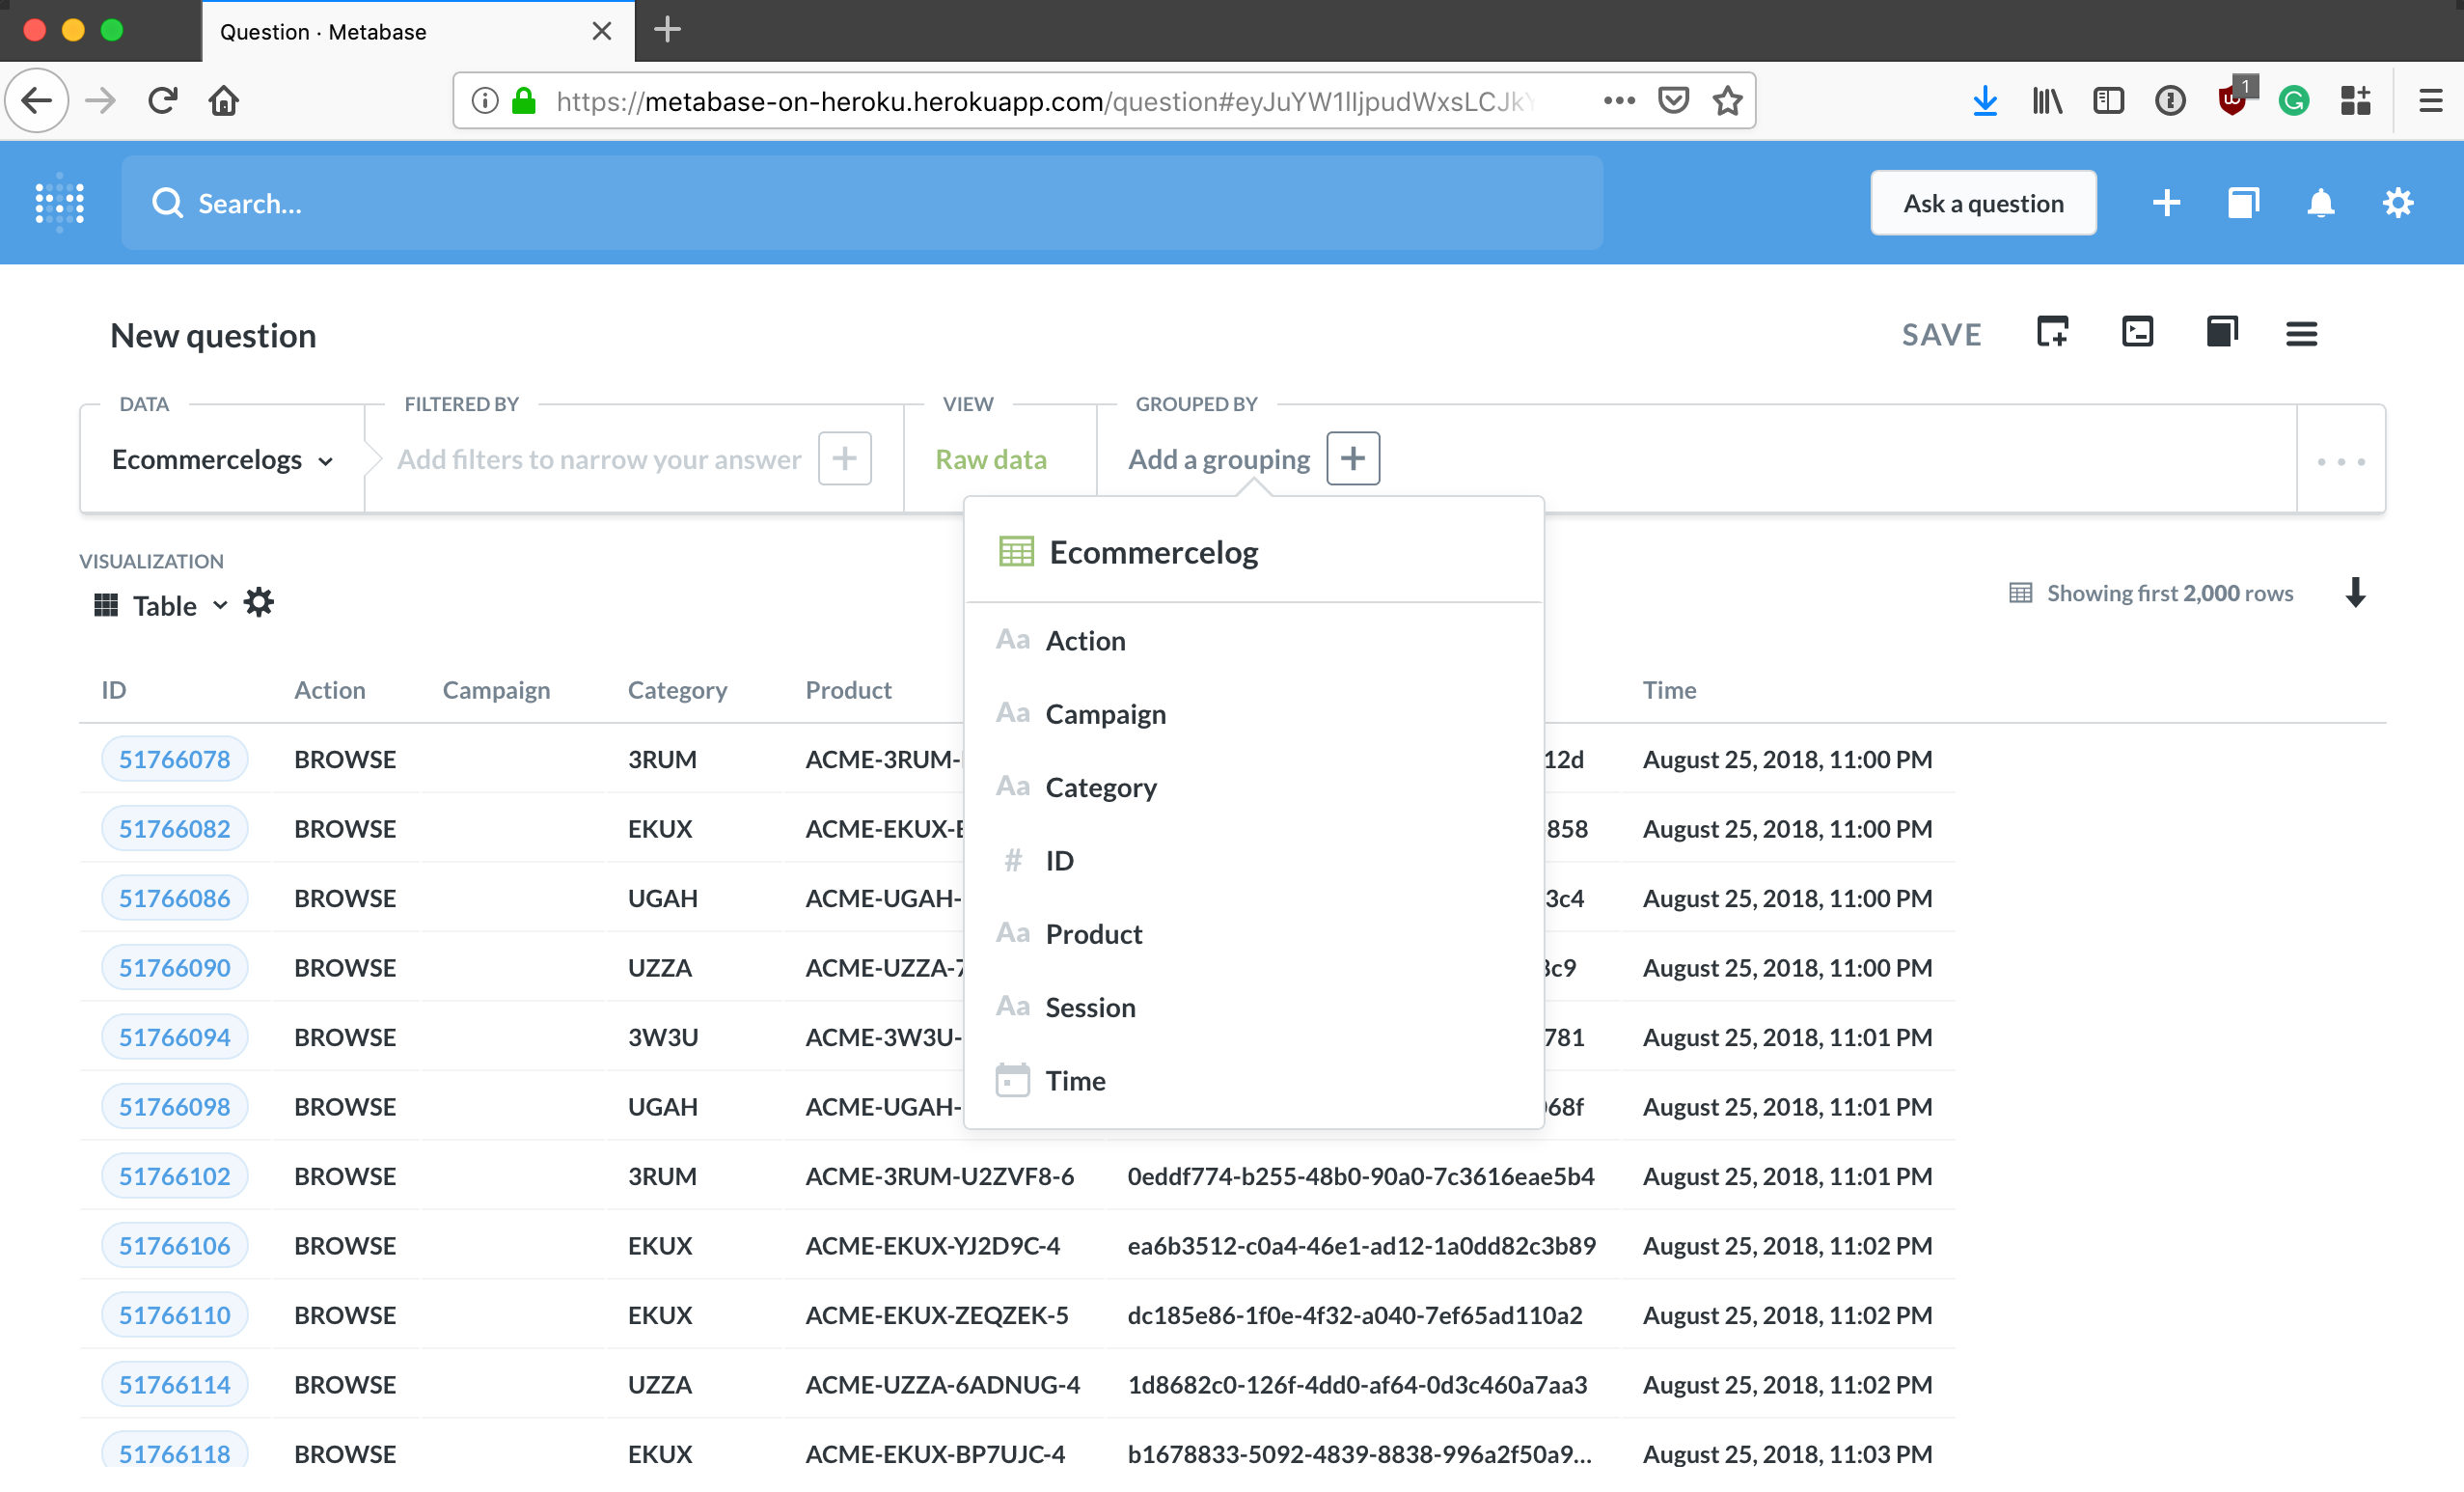
The final piece of our system is the ability to use SQL to query and visualize data in Redshift; for this we can use Metabase, a free open-source product analytics tool that you can deploy to Heroku. Once deployed, you'll need to configure Metabase with the RedShift cluster URL, database name, username, and password.
Now members of your team can kick back, use Metabase’s point and click interface, write ad-hoc SQL queries, and create product analytics dashboards on top of the millions of events your users generate daily, trended over time.
Summary
Event-driven architectures and real-time analytics are an important feature of a modern web app on Heroku. In that post, we mentioned that customer facing applications are now at the core of every business; those same applications are continuously producing data in real-time at an accelerated rate. Similar to the way applications and code are now containerized, orchestrated and deployed continuously, high-volume event streams must be managed and moved in an organized way for visualization and analysis. We need to extend our web app with a system comprising
- A tool that can manage large streams of data reliably and to which data producers and data consumers can easily attach themselves
- A data warehouse tool to organize the data and make it queryable quickly
- Data query and visualization tools that are simple to connect to the data warehouse and easy to start using
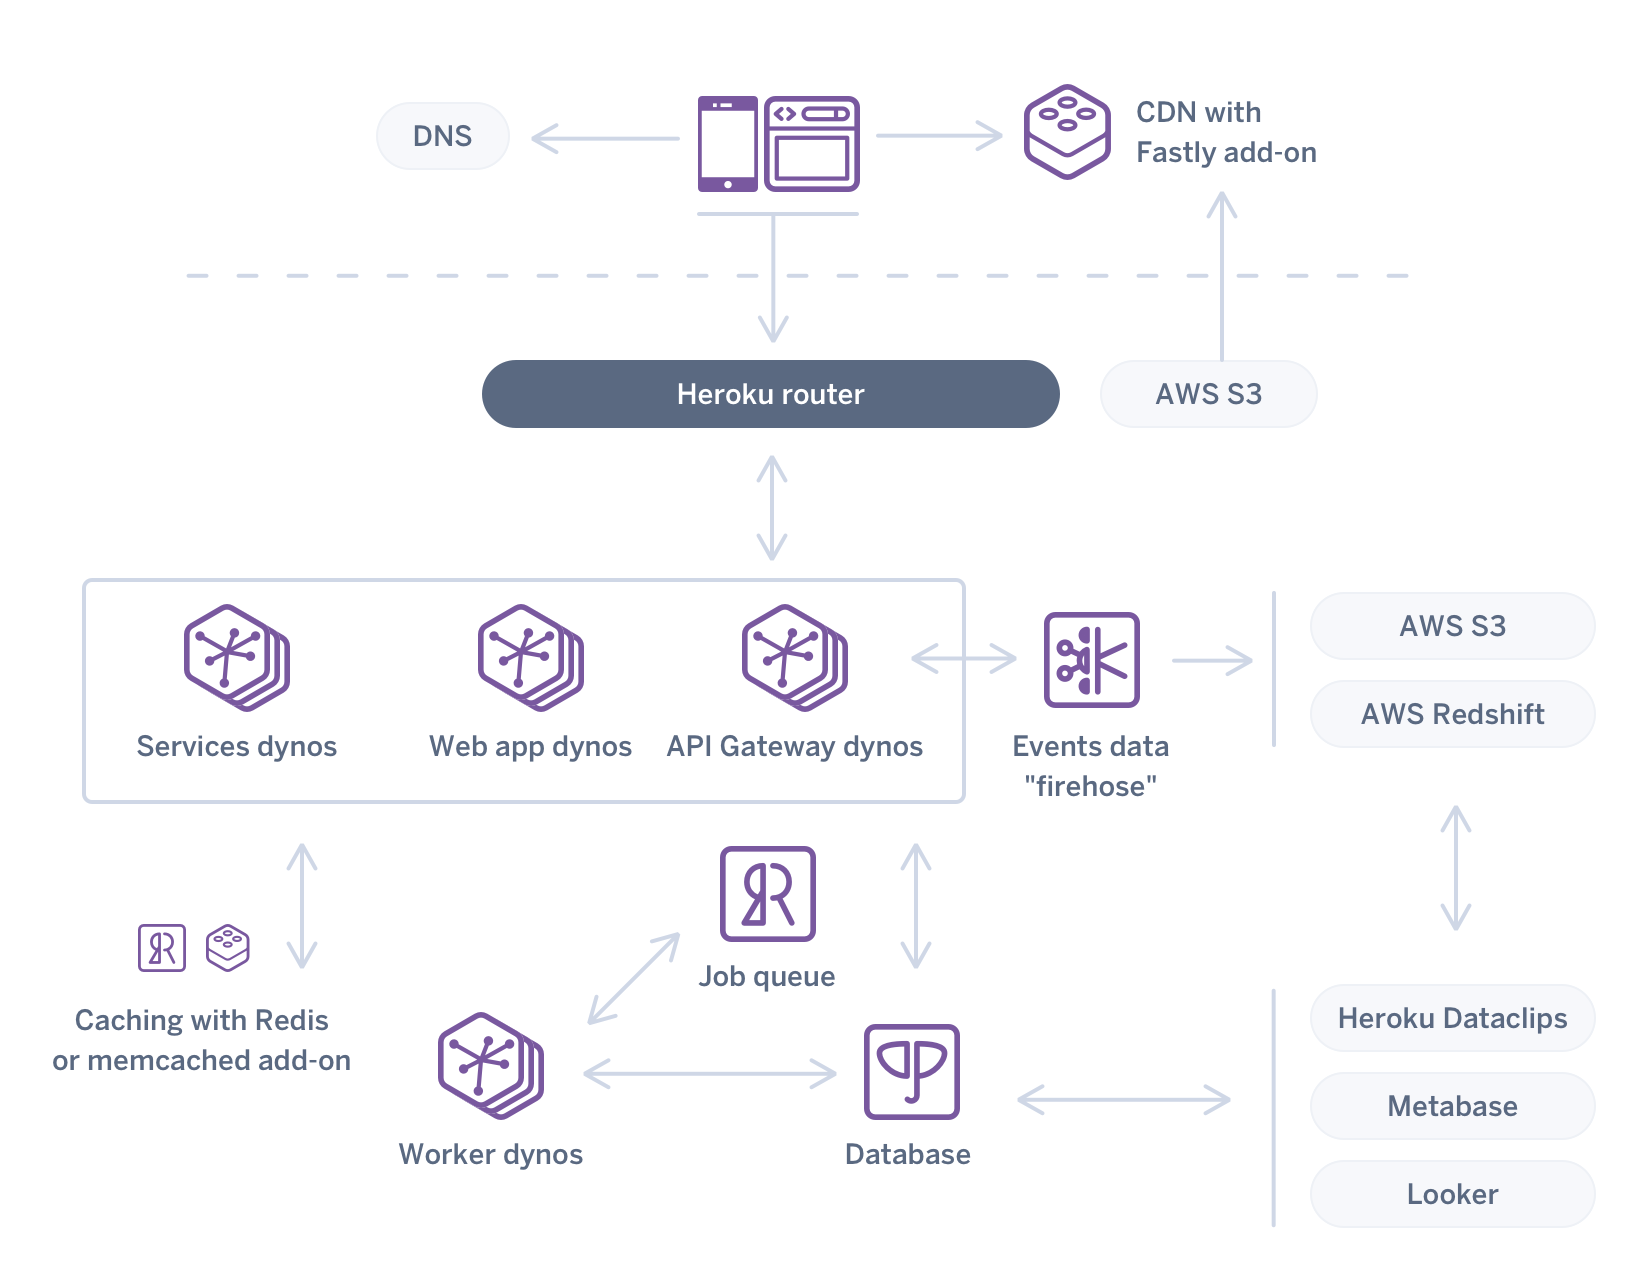
Specifically in this post, we've covered just one implementation of the lower-right of this diagram: events data "firehose", Amazon Redshift and Metabase.
And while the implementation of this stream processing system can be as simple or complex as you want, Heroku simplifies much of the DevOps of this system via a fully managed Kafka service that is integrated with consuming and producing Heroku apps that can be horizontally and vertically scaled. Heroku’s easy and secure composability allow the data to be moved into an external infrastructure service like Amazon Redshift for analysis with open source tools that can run on Heroku. The system in this post can be provisioned on Heroku in 15 minutes and was built with a team of 2 developers working sporadically over a two week period. Once provisioned it can run with minimal overhead.
I want to extend a huge thank you to those who helped me write or otherwise contributed to this post: Chris Castle, Charlie Gleason, Jennifer Hooper, Scott Truitt, Trevor Scott, Nathan Fritz, and Terry Carter. Your code, reviews, discussions, edits, graphics, and typo catches are greatly appreciated.
Footnotes
1While I refer to generate_data, viz, and redshift_batch as apps, they are actually three process types running within the same Heroku app. They could have instead been deployed as three separate Heroku apps. The project was architected as one Heroku app to simplify initial deployment to make it easier for you to test out. Sometimes this is referred to as a monorepo—i.e. code for multiple projects stored in a single repository.