Heroku Postgres brings the Heroku flow to your database, offering safe and straightforward provisioning, scaling, development and collaboration. Traditionally, generating and sharing data from within databases has been inconvenient and challenging. What if you could safely and easily capture and share the data you need to drive your business?
Dataclips, available on all Heroku Postgres production and starter databases, let you run SQL queries against your data and share the results in an easy, visual way with your team members.
Dataclips can be downloaded or shared via URLs, are downloadable and exportable in many formats, and are executed via a read-only transaction so your data stays safe. To get started with dataclips, check out our Dev Center article.
Using Dataclips to Make Awesome Business Dashboards
At Heroku, we integrate multiple dataclips into Google Docs Spreadsheets, and use the chart and graphing functionality to create custom dashboards. Recently, we used the GitHub API to extract data about our commits to Heroku repos over the past six months and store them in Heroku Postgres. We used dataclips to generate data for specific queries, such as total number of commits per day, top committers, and longest and shortest commit messages. We then integrated the dataclips into Google Spreadsheet, which automatically updates when new data is available, and used it to generate a dashboard of our GitHub activity over the past 6 months.
Step 1
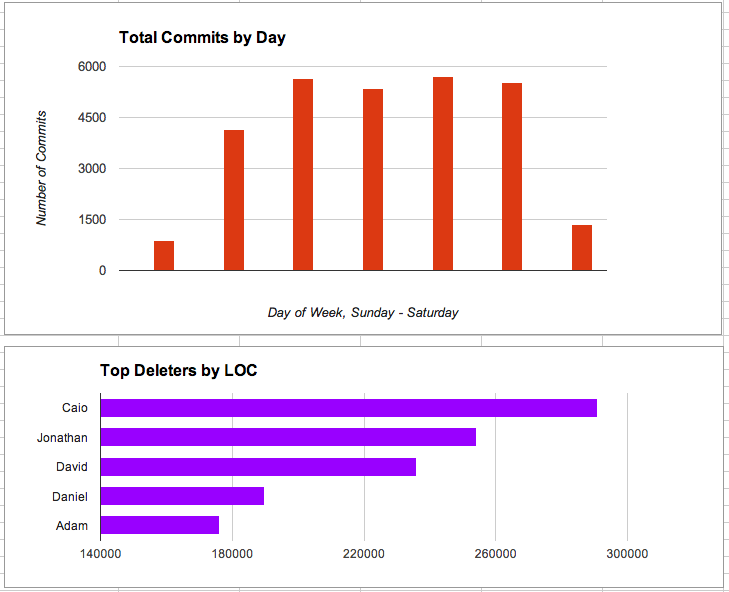
First, we use dataclips to query the dataset. In this example, we're querying the total number of GitHub commits by our teammates over the past six months, broken down by day.

Step 2
When you create a dataclip, you can share the data easily using a URL. You can also use that URL to integrate the data with other business tools, like Google Docs. Generate a new Google Spreadsheet automatically from the drop down menu of your dataclip, or use the importData() function, shown below. This populates your spreadsheet with data from the dataclip, which will auto-update over time:

Step 3
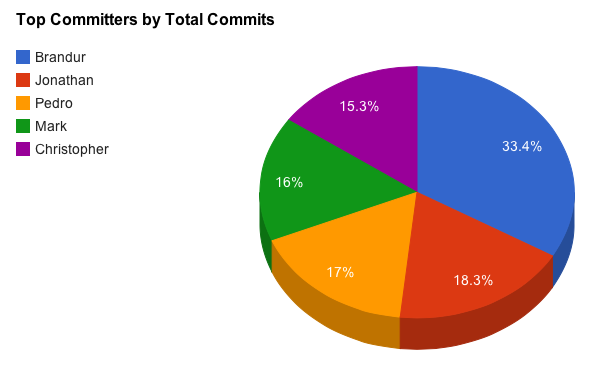
Once your data is integrated with your spreadsheet, you can use the built-in chart functionality to generate robust graphs and visualizations of the data:

Please note that dataclips should NOT be used as an API. The options for endpoints (JSON, CSV, XLS) are great for low-volume background processes such as lightweight integrations and prototyping APIs, but does not replace a production API.
Internal Use Cases
Here are some other ways we use dataclips internally to drive our business.
Postgres Business Dashboards
Our Postgres team brings together multiple dataclips and integrates them with Google Docs, creating a full business dashboard. We import and graph dataclips related to the core health of the business, including overall revenue, how support issues break down by type of incident, attrition rate over time, database provisioning time, and the top users and customers. This gives us a full perspective into our business at any given time, and is easy to share within our company.
Identifying Platform Abuse
Dataclips also play an important role in identifying and addressing platform abuse. First, we identify trends that are correlated with or suggest abusive behavior such as spamming and phishing. Once we identify pattern that abusive attacks take, we can set up a dataclip that looks for actions matching the pattern. For example, sometimes we see sudden spikes in account creation from certain providers, but no additional platform activity - a pattern that can indicate spam operations. We use the JSON or CSV version of the dataclip to bring this data into abuse prevention apps for closer scanning. The lets our security team work better and faster - we don’t have to hardcode complicated queries into our apps, there is no need to redeploy if we want to change a query, and we don't have to give our security apps full access to the underlying databases - just to the behavior patterns we've identified.
Creating a Data-Informed Business
Data alone isn’t enough to create a business where meaningful metrics and quantitative insights are driving better business decisions, faster. Data must be omnipresent in your culture, easily accessible to all of your team members, shareable within and across departments, and flexible enough to integrate with existing business tools. Heroku Postgres dataclips unleashes your data so your team can put it to work.